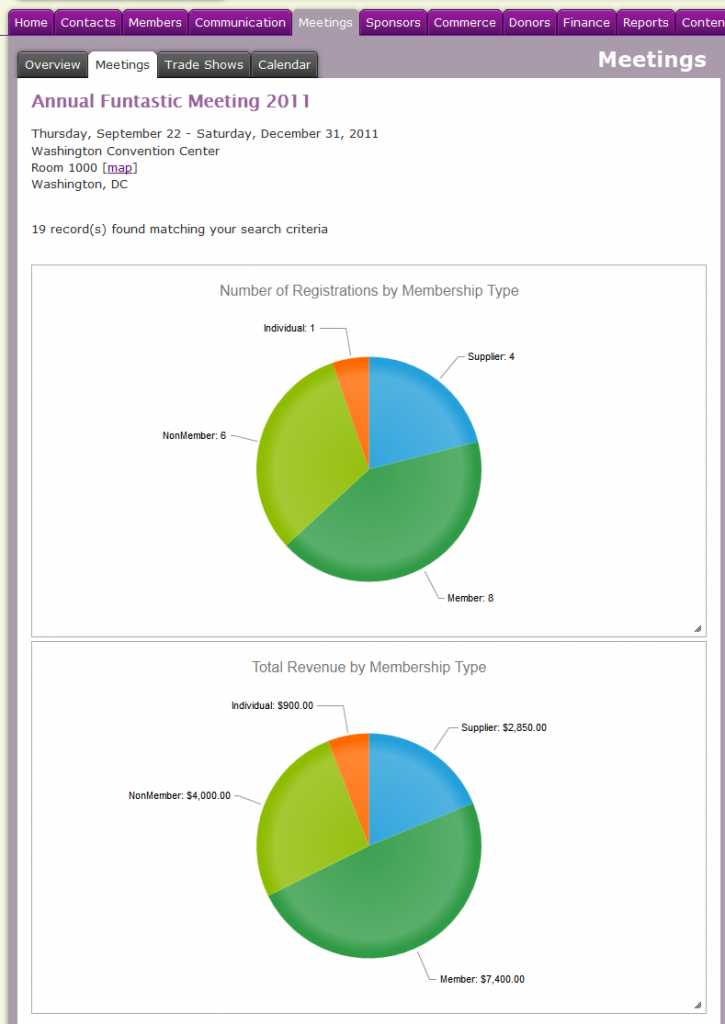
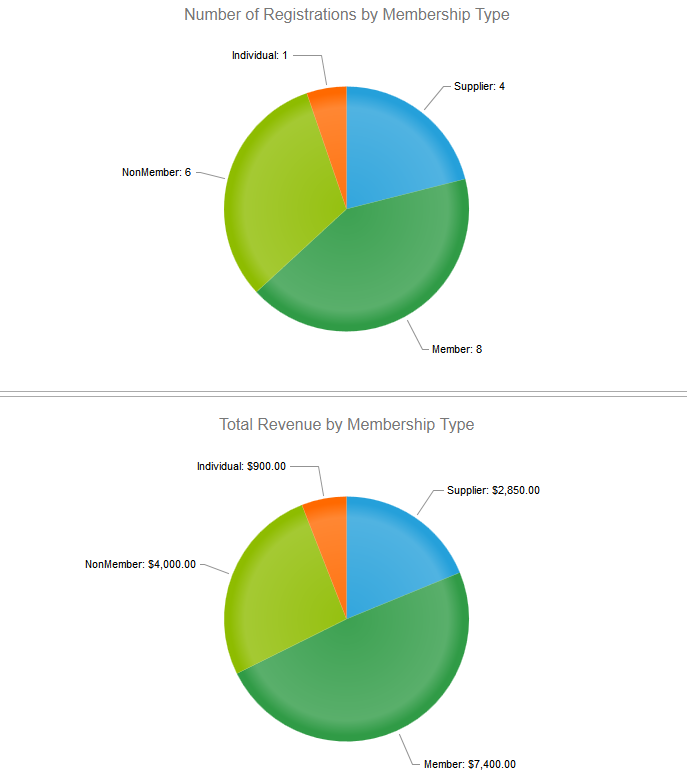
Version 13.2 of MatrixMaxx was released last week and it had several notable, new features related to visualization. The first is an infographics builder that lets clients chart meeting registrations against membership data and individual demographics. For example, a client might chart meeting registrations by member type, job level and job function. The second is a dynamic mapping feature that lets clients take a data set and map it. Let’s take the meeting example again. Clients can now push a button to see the spread of meeting attendees across the US.
Why this emphasis on visualization?
I believe that in this age of big data, we’re drowning in statistics and reports, but we’re starved for insight and trends (sorry for the mixed metaphor). Our CRM (customer relationship management) and AMS (association management software) systems are tracking all kinds of demographic data and transaction history but what are we really learning about our customers?
If I have a list of 1,200 meeting attendees, organized by last name, company or state, I have a roster. A report that gives me total attendees by state will show me where my attendees are coming from. If I plot that data on a map, I might learn that most of my attendees are coming from the coasts or the southern states. Now imagine if I took the same list and plotted it against industry, type of business, job level or number of plants, what would I learn that isn’t at all obvious from looking a list of attendees?
Ever notice how your boss or your Board is always asking for charts and graphs? It’s usually because they’re cold on an issue and summary data, along with visualizations, can give them the 20,000 foot view they need to make strategic decisions.
Here are some example of amazing visualizations that tell a great story:
- The State of the Internet shows us how far we’ve come, how much time we spend online and where that time is going. http://www.pcmag.com/article2/0,2817,2413424,00.asp
- Method, a design and branding agency, mined Google to figure out what consumers were searching for when looking for a tablet, and created a consumer interest infographic to display their findings. http://www.fastcompany.com/1790942/infographic-day-what-do-people-want-tablet-computer
- 512 Paths to the White House shows what outcomes President Obama or Mitt Romney would have needed to win the 2012 election, and the ways they could win. http://www.nytimes.com/interactive/2012/11/02/us/politics/paths-to-the-white-house.html
- The AIDSVu project uses infographics to highlight the impact of the disease on specific populations, e.g., African-Americans or Latinos. http://www.aidsvu.org/national-black-hivaids-awareness-day-2013
My prediction: infographics and visualization tools will continue to grow and dominate our thinking and analysis.